BUSINESS / DATA ANALYTICS
PORTFOLIO
HARIKA BOJANAPATI
As a Master of Science in Management- Business Analytics major at NJIT, I’m driven by diligence, determination, and a strong passion for both technical domain, alongside management. My interest in this path was ignited through hands-on experience at an AI company, which deepened my fascination with technical solutions and data-driven decision-making. My entrepreneurial mindset and adaptability, combined with real-world business exposure and academic rigor, fuel my commitment to transforming complex data into actionable strategies. In today's fast-paced business environment, Data Analysis has become instrumental in driving strategic decision-making and achieving sustainable growth, whether it could be technology, health care, finance, mafucturing, retail & beyond. I can facilitate informed decision-making processes that optimize operations, uncover market opportunities, and enhance overall business performance through data analytics. I’m dedicated to continuous learning and seek oppurtunities that enhance my expertise and career growth in analytics.
This portfolio showcases my expertise in data visualization using Tableau, Power BI, and Excel; data mining techniques utilizing Python; SQL for data management, query, and analysis, through operations such as retreiving data, updating records, and defining table structures; and decision analysis/supply chain optimization techniques through excel.This portfolio includes a curated selection of my work. There's much more that I have done, which I'm eager to discuss in more detail.
I hereby declare that all the work presented in this portfolio is my own and has been completed independently, with a solid understanding of the concepts.“My Professional Philosophy”—I'm a firm believer that professionalism isn’t just about delivering results—it’s about how you treat people along the way. I value clear communication, empathy, and responsiveness in every interaction. Whether it’s solving a tough problem, leading a project, or simply replying to an email on time, I approach it with care and intention. I take pride in being someone who listens actively, communicates clearly, and always considers the bigger picture.
------- To ensure the best viewing experience, please view the portfolio on a laptop or desktop, as mobile layouts mayn't display all elements properly -------
INTERACTIVE DASHBOARDS
TABLEAU
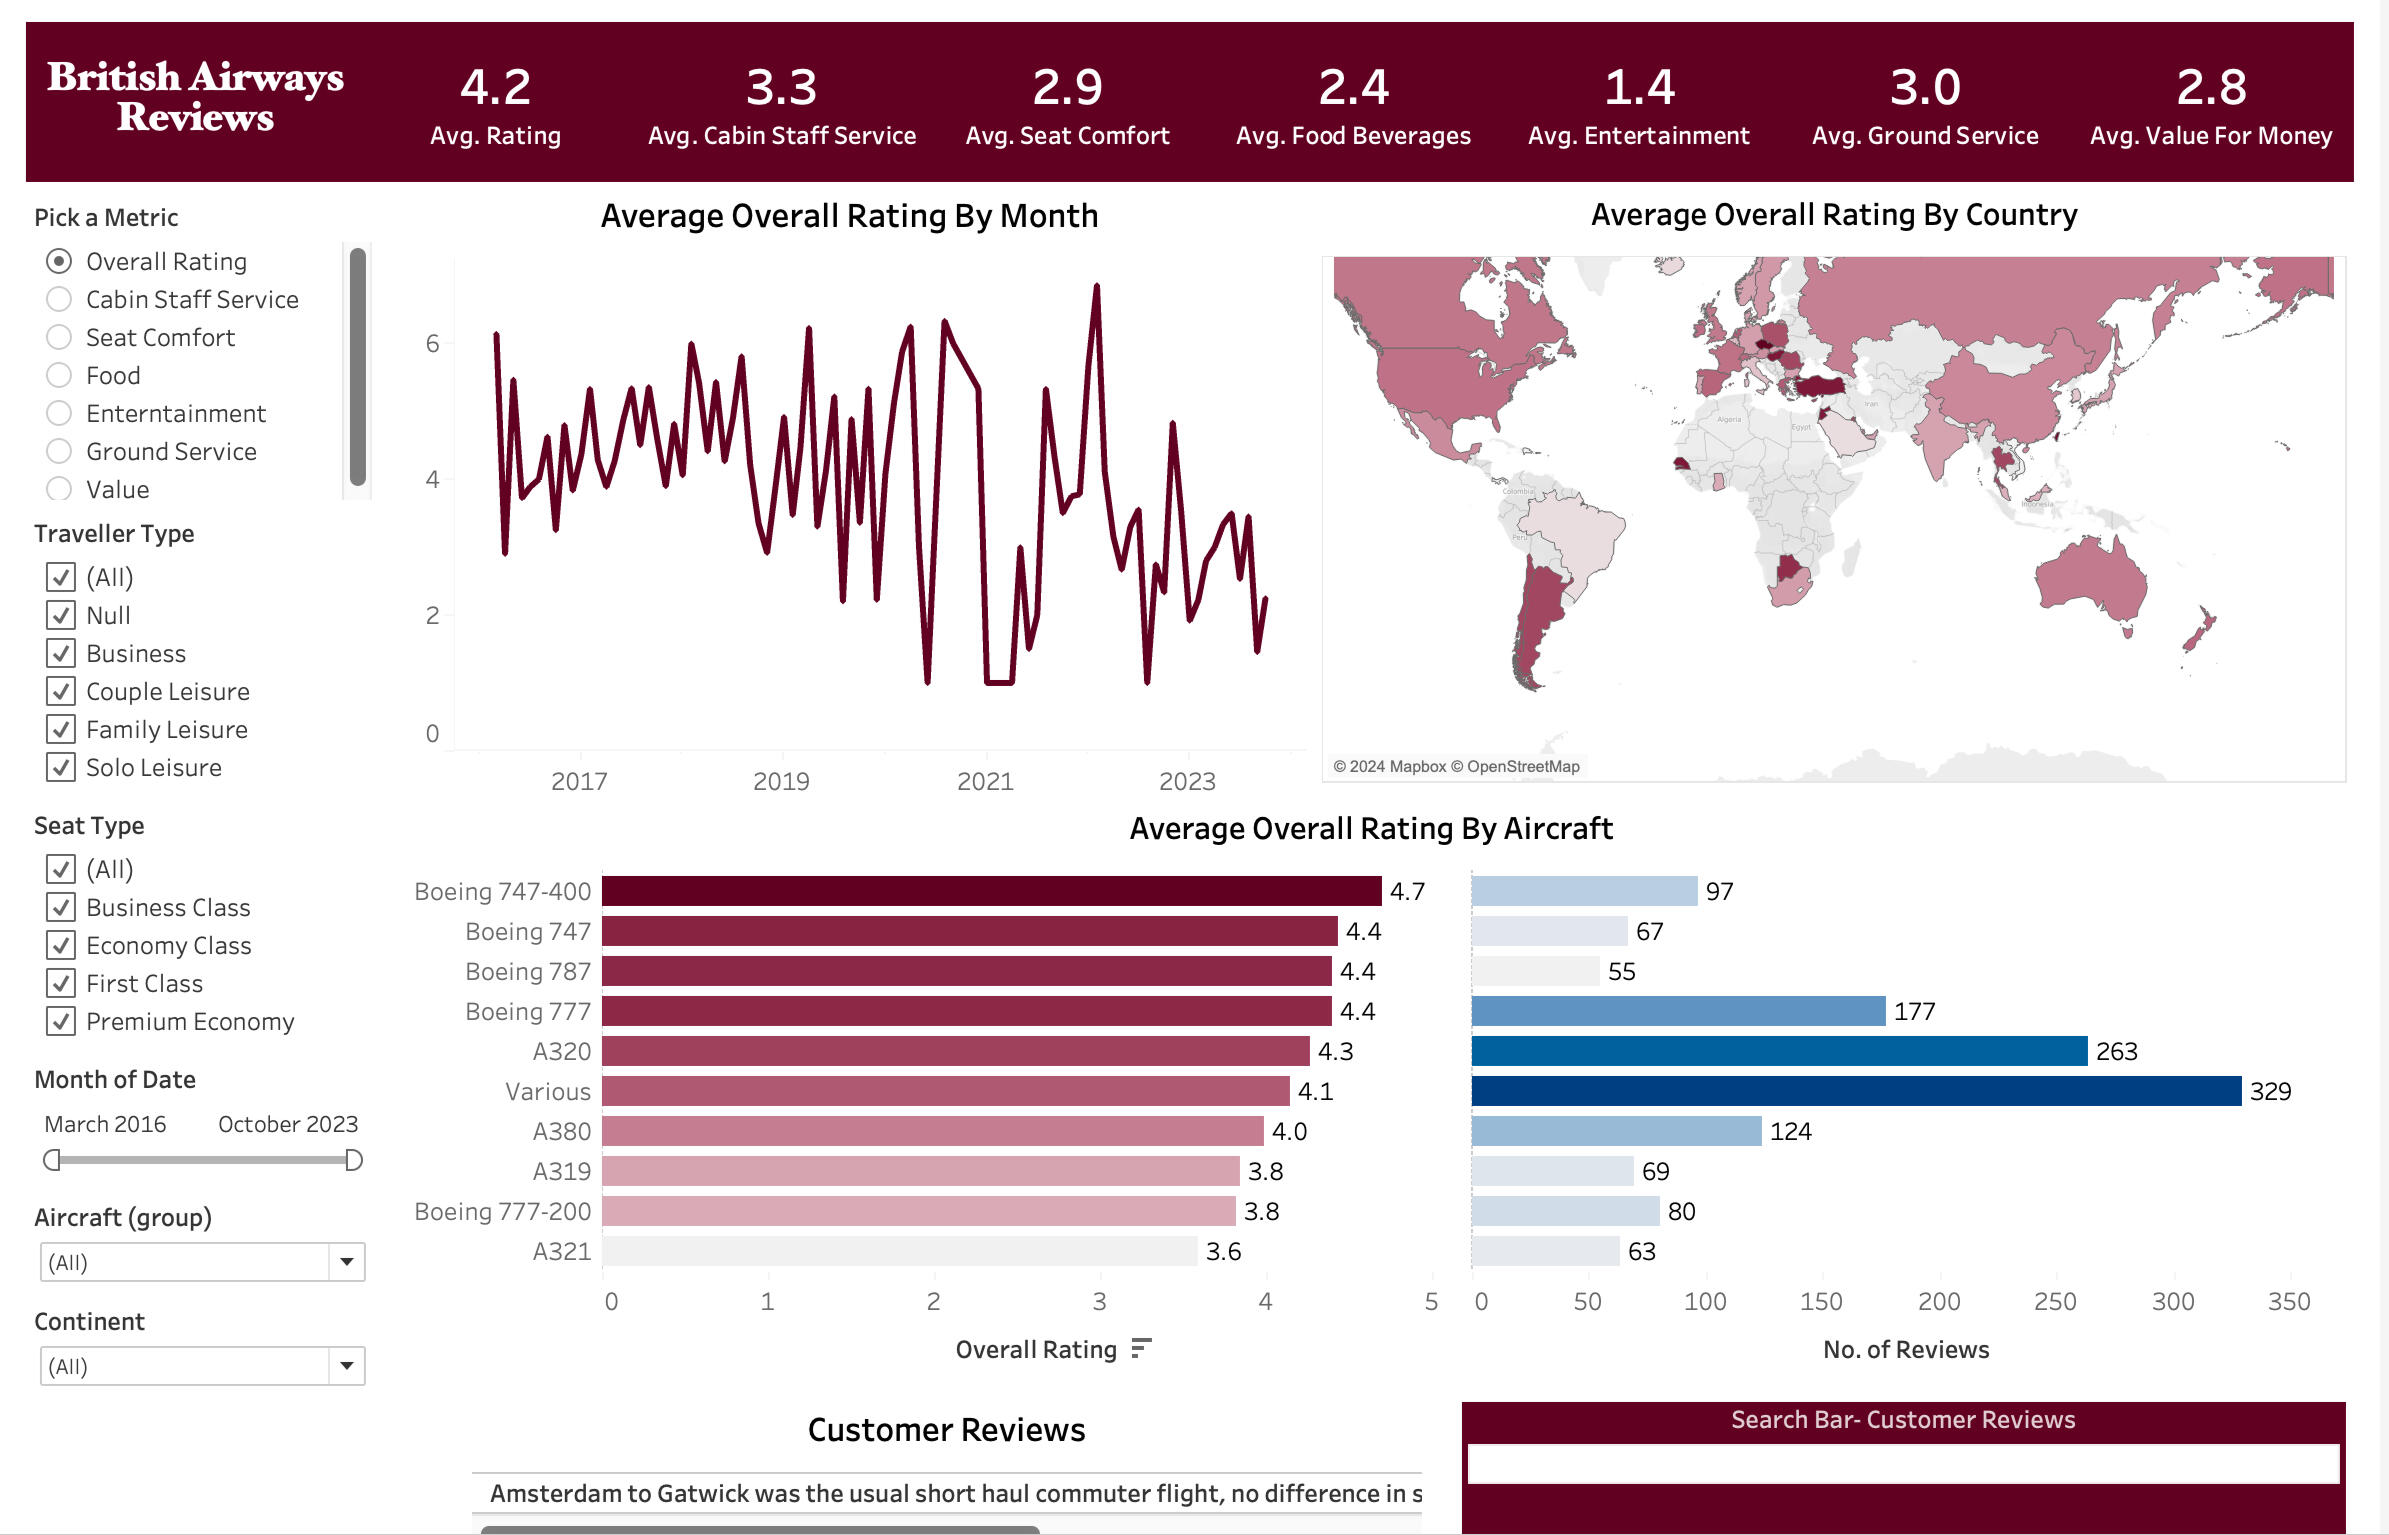
An intriguing feature of this dashboard is the search box, which allows users to display reviews containing any word entered in the search field

POWER BI
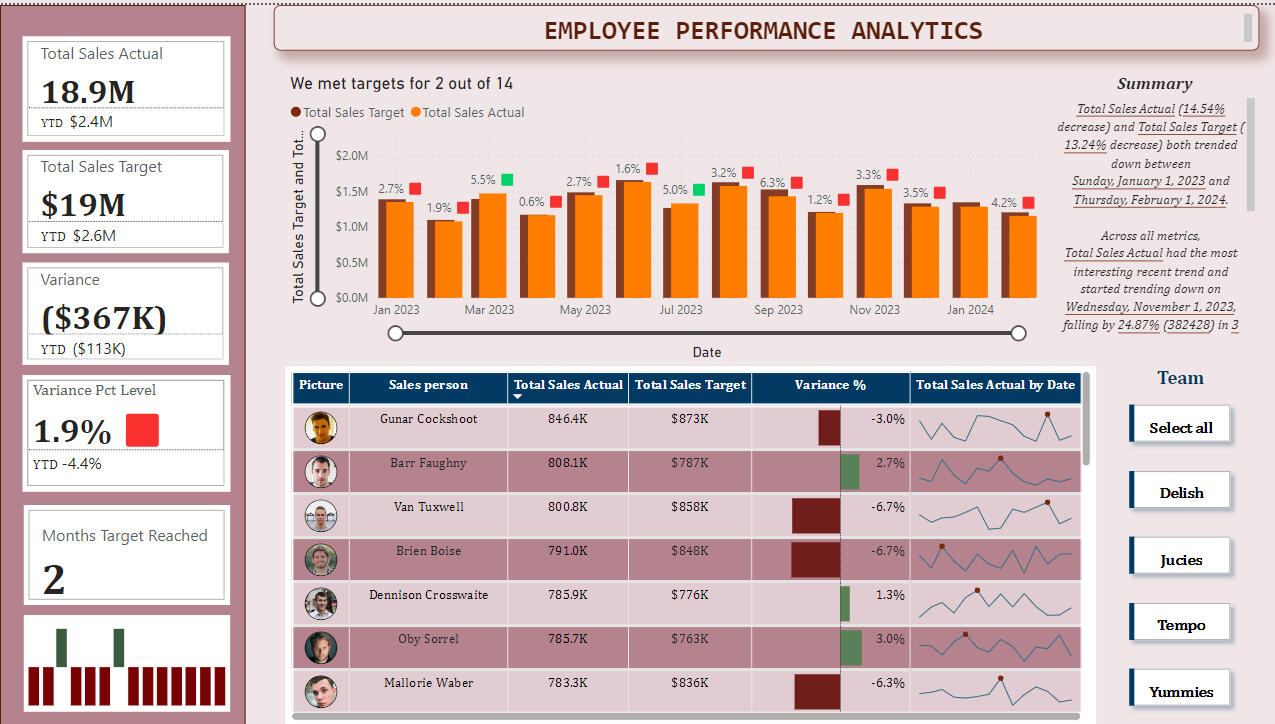
An intruiging feature in this dashboard is automated summary generation features, based on the targets selected.
EXCEL

DATA MINING USING PYTHON - PREDICTIVE & DESCRIPTIVE MODELLING
DECISION TREE FOR LOAN REPAYMENT
(Note: The coding sessions from Jupyter Notebook were screen-recorded & included as videos in the portfolio to maintain a clean layout while showing complete code and outputs, ensuring clutter free presentation)
Decision tree algorithm was employed to predict whether a customer would repay a loan or default. The process began with cleaning the dataset by removing irrelevant columns, such as house number, which would not contribute or add value to the prediction. Next, the data was split into training and testing sets. The decision tree was trained using the entropy criterion, which helps in splitting the data based on the most informative features. Predictions were then made, classifying customers as either "Yes" (will repay) or "No" (will default). Finally, the results were visualized as a decision tree using scikit-learn, providing a clear representation of the decision-making process.
LINEAR REGRESSION
To understand the relationship between dependent and independent variables in the dataset, I employed linear regression. The process began with exploratory analysis, where scatter plots were developed to visualize how each independent variable relates to the dependent variable, which in this case was the yearly amount spent. By consolidating these scatter plots into a single visualization, I could better grasp the overall relationships. Following this, I split the data using scikit-learn to create training and testing sets, which allowed for model training and evaluation. Interpreting the coefficients provided insights into the influence of each independent variable on the dependent variable. Predictions were then made using the trained model, and errors were assessed through residual analysis to evaluate the model's accuracy and fit.
TIME SERIES FORECASTING
The data was first visualized to identify patterns, and trends. Making the time series data stationary was necessary to stabilize its mean and variance, which is crucial for reliable forecasting. Correlation and autocorrelation plots were then used to understand internal relationships and dependencies, helping to determine appropriate model parameters. The SARIMAX model was constructed to account for seasonality and other external factors influencing the data. Finally, the model was used to predict champagne sales for the next three years based on the identified patterns and trends.
DESCRIPTIVE MODELLING - K MEANS ALGORITHM
The K-means clustering algorithm was applied to analyze the FIFA dataset, grouping players based on attributes such as potential, overall performance, positions, value, wages, and age. K-means operates by iteratively assigning players to clusters based on their similarity, with each cluster represented by a centroid. The algorithm refines the clusters through repeated updates of centroids and reassignment of players until convergence, ensuring that players within each cluster are more similar to each other than to those in other clusters. This iterative process helps in effectively organizing players into meaningful groups based on their attributes.
SQL - MYSQL
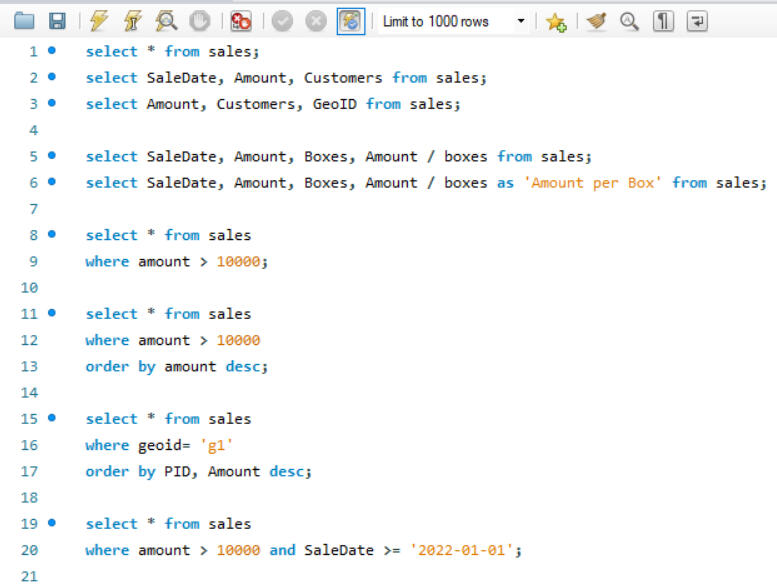
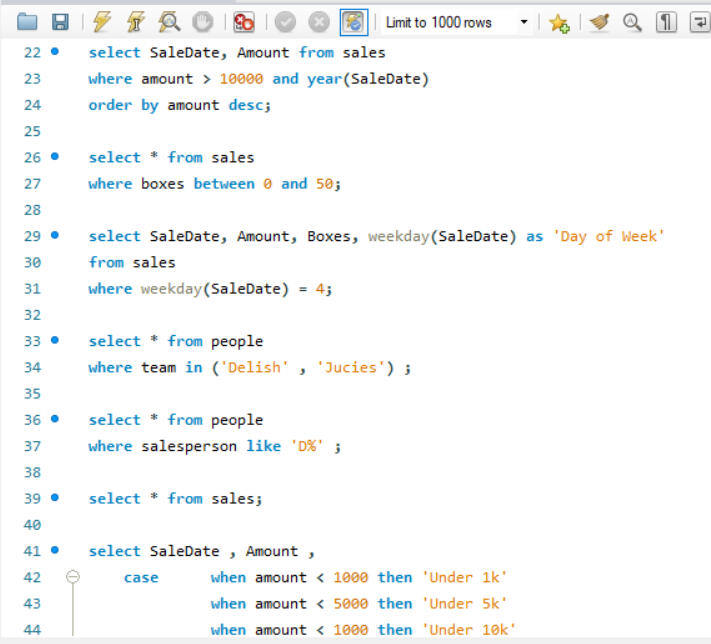
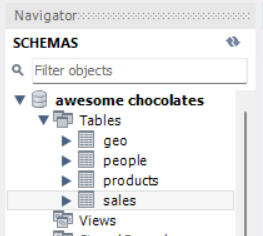
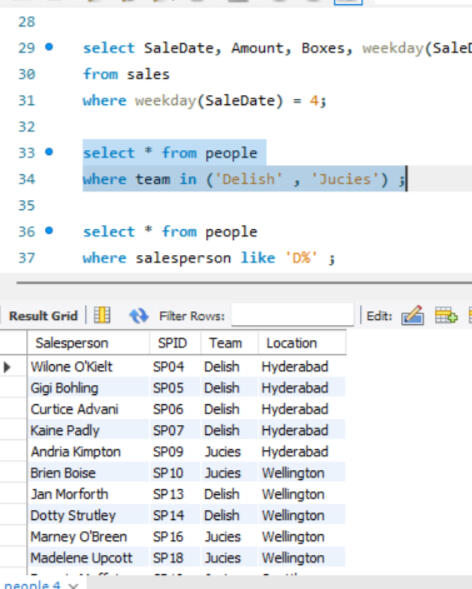
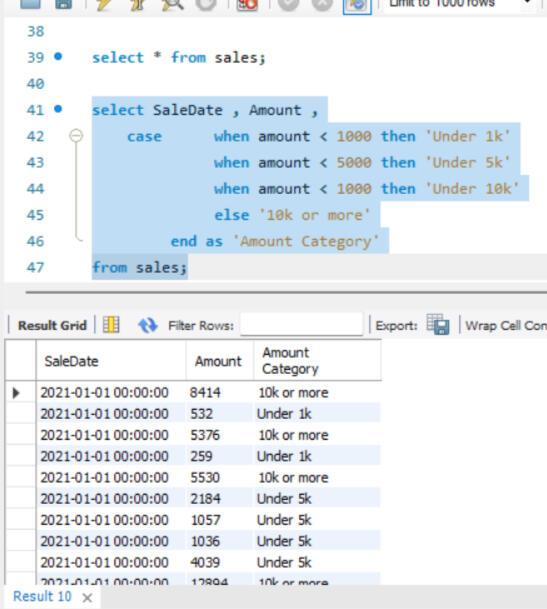
The SQL dataset for Awesome Chocolates involves a comprehensive range of operations. It includes setting up the dataset and schema, adding calculated columns within the SELECT statements, and employing the WHERE clause to filter results. The project also covers sorting query results based on various conditions including BETWEEN , handling dates, and integrating data from other tables from schema. Additionally, it utilizes the IN clause and CASE statements to implement conditional logic and branching.
OUTPUT GLIMPSES
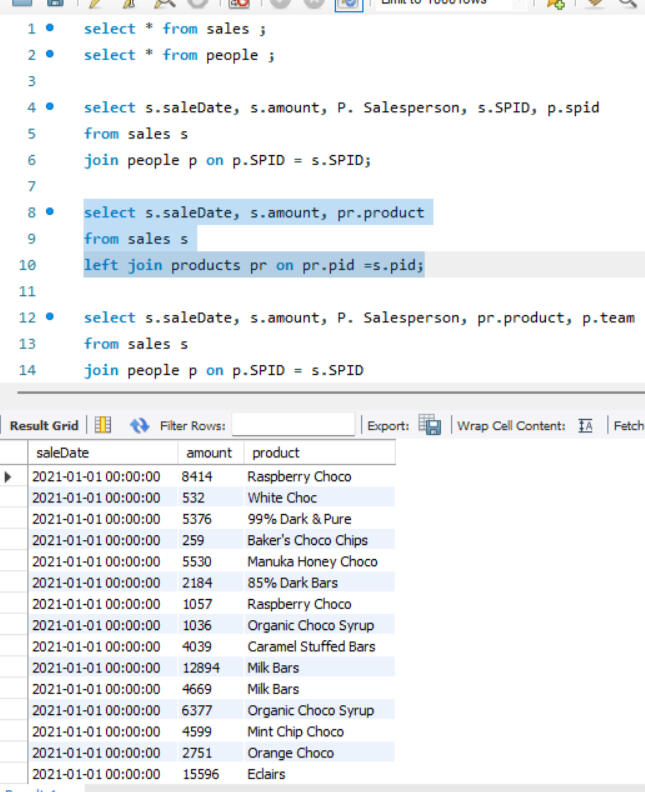
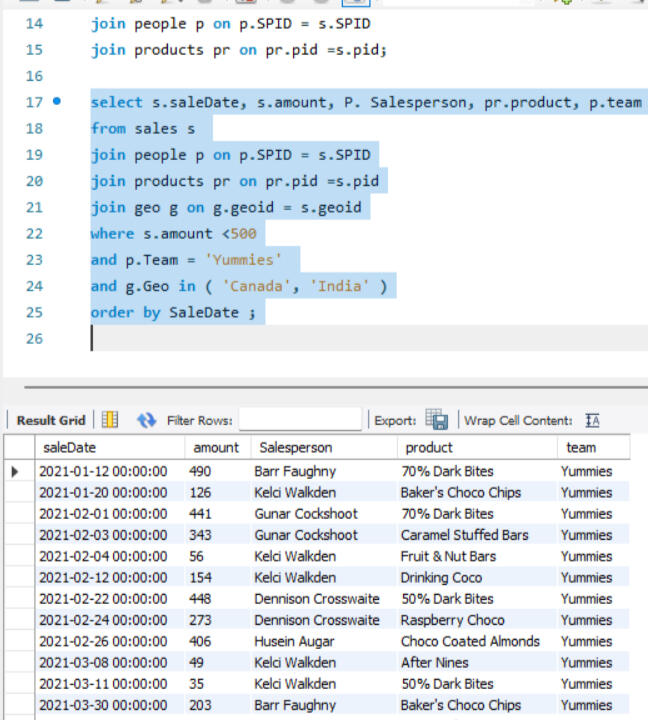
JOINS
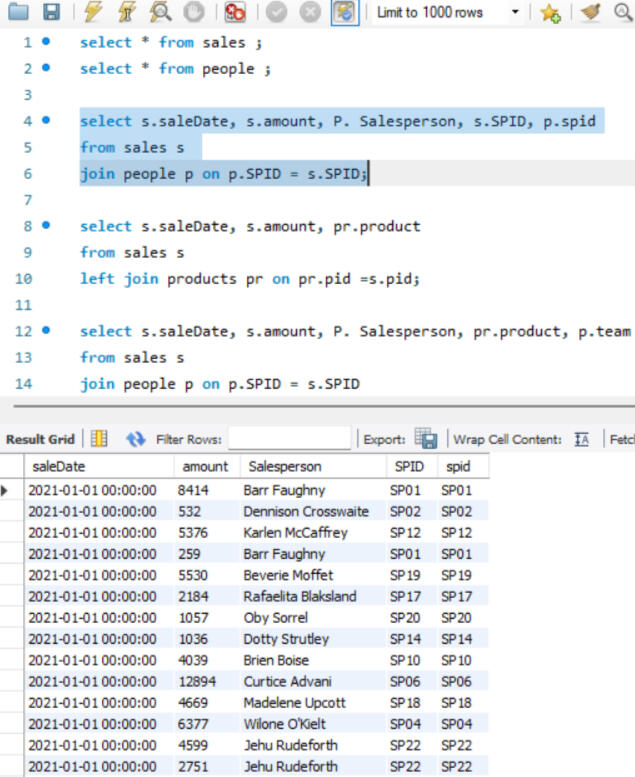
GROUPING
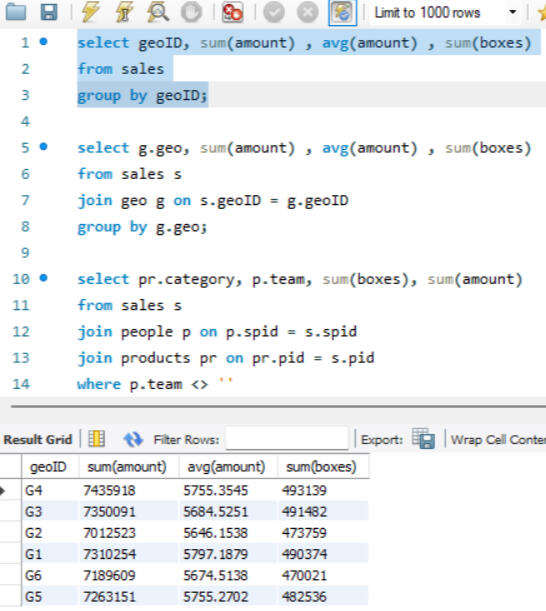
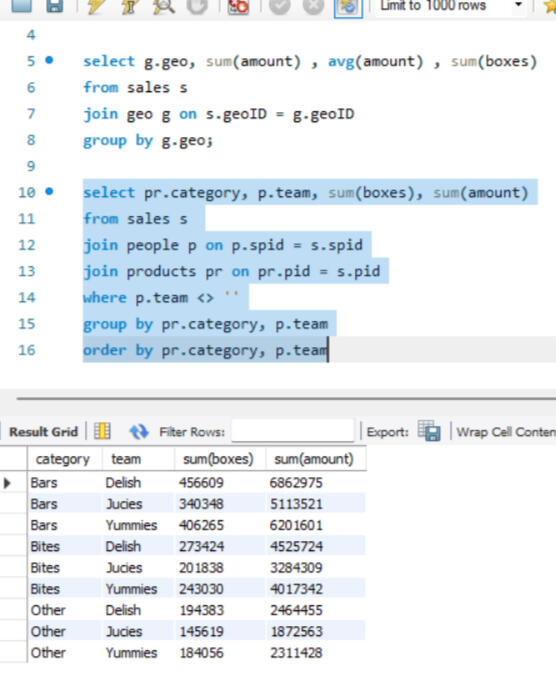
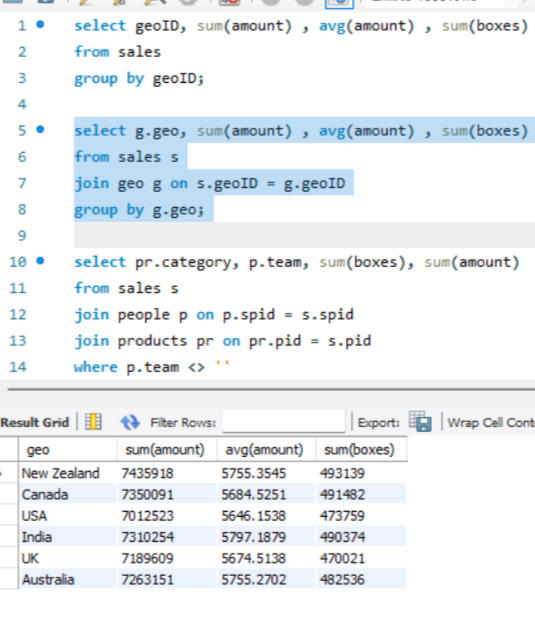
Here joins are used to combine data from two different tables, such as Sales and People. Each join type determines how records from the tables are matched and combined, ensuring that the appropriate data is selected for analysis or reporting, after which grouping is done.
CREATING NEW TABLES/ DATA SET
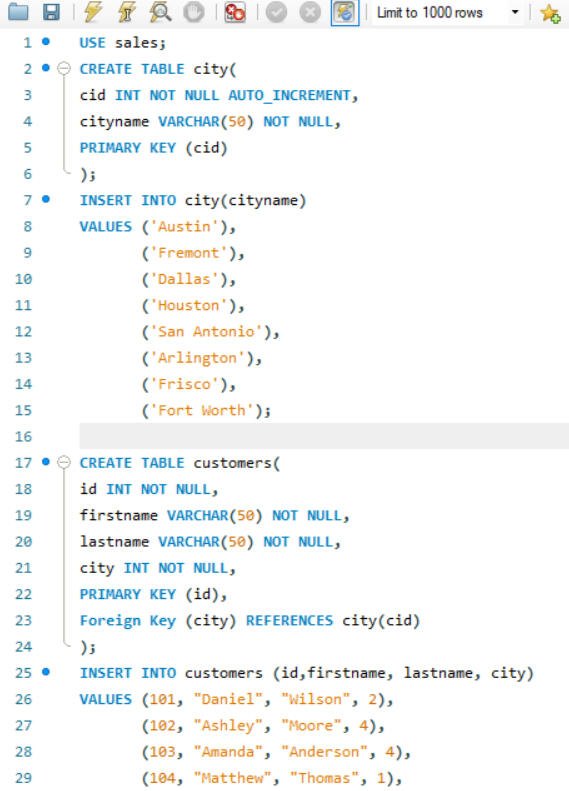
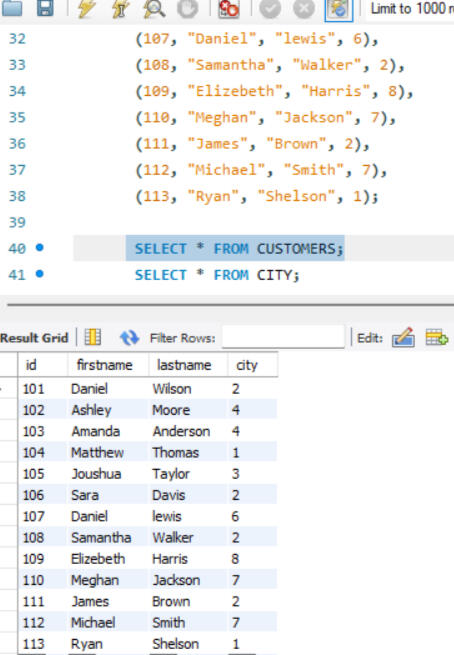
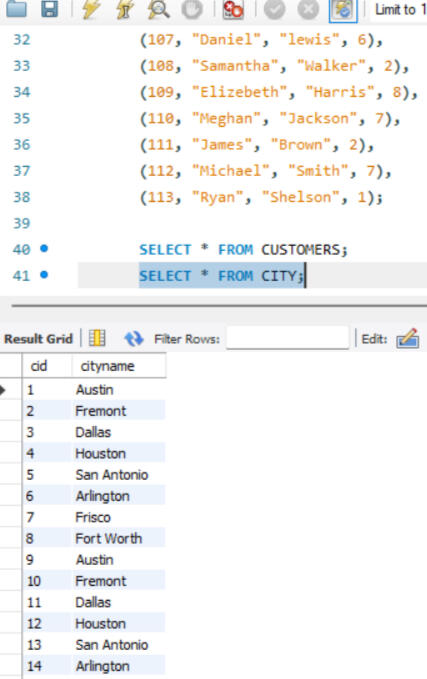
One of the key functionalities of SQL is the ability to create and manage datasets. Here, I created a dataset comprising two tables: customers and city. The customers table includes fields such as customer_id, first_name, last_name, and city_id, while the city table includes city_id and city_name. In this setup, customer_id in the customers table and city_id in the city table are designated as primary keys, ensuring their uniqueness for each row. Other attributes, such as city name and customer details, may vary. Additionally, I established a foreign key relationship between these tables. Specifically, the city_id column in the customers table acts as a foreign key, linking it to the city_id column in the city table. This foreign key relationship helps maintain referential integrity and facilitates the creation of meaningful connections between the two tables.
JOINS
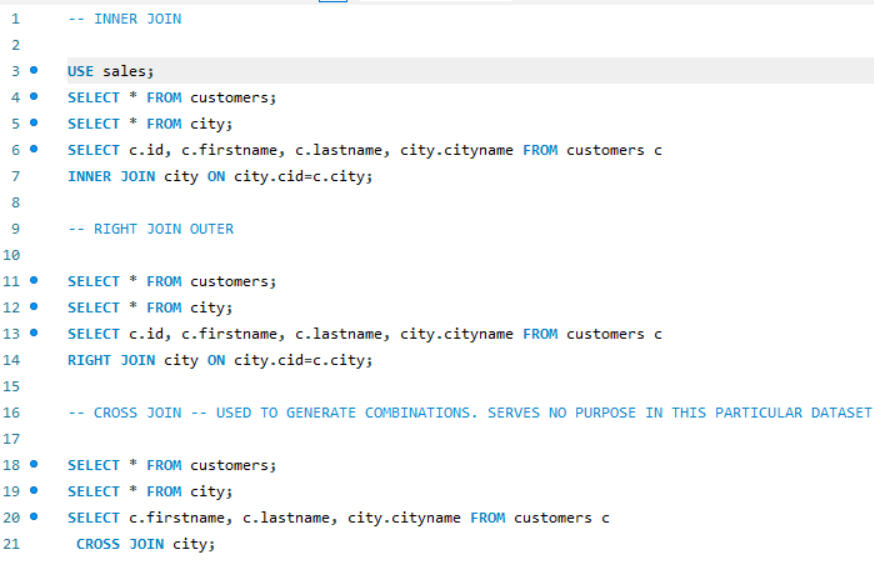
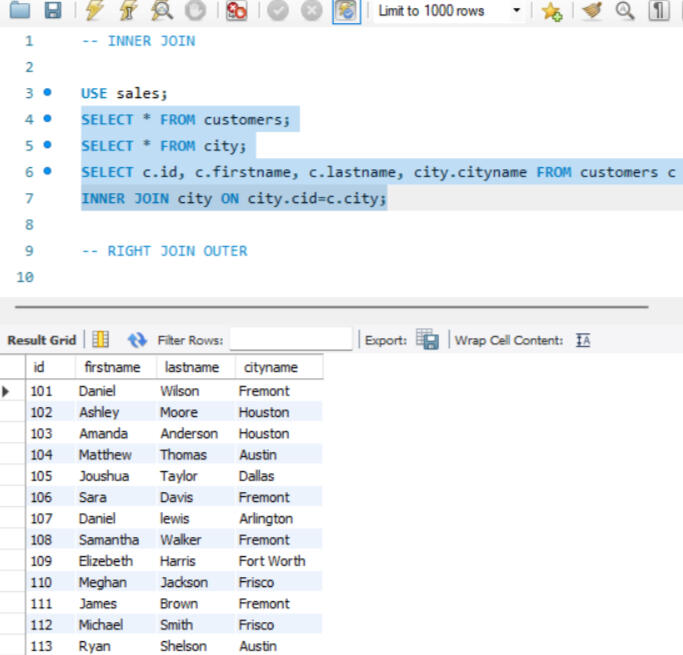
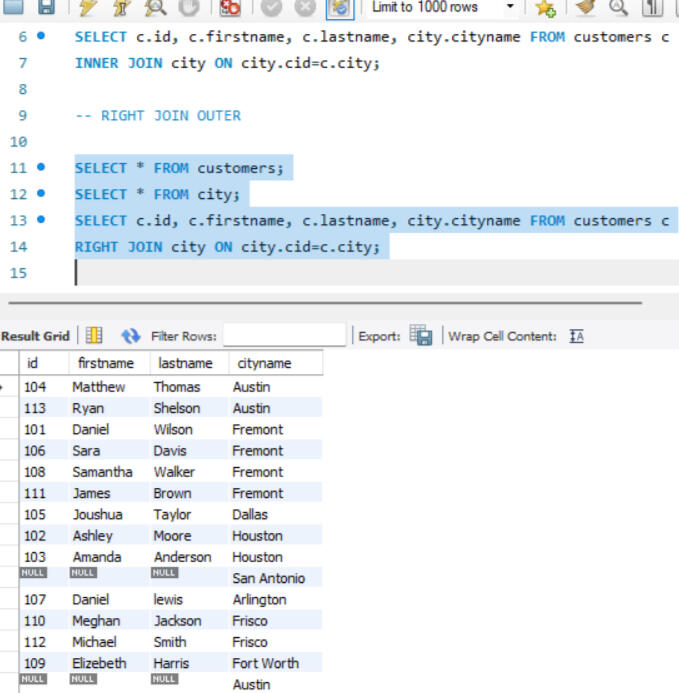
Depending on the specific requirements, joins ike INNER JOIN, RIGHT JOIN were utilized to retrieve the desired data.
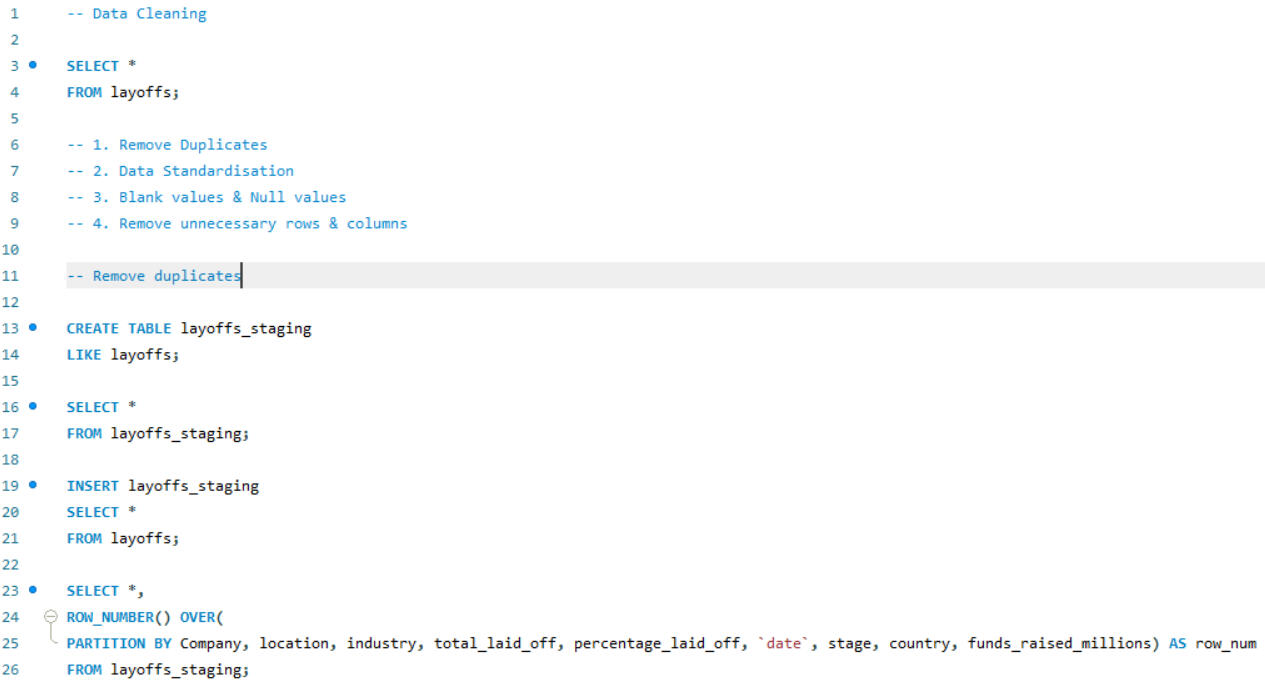
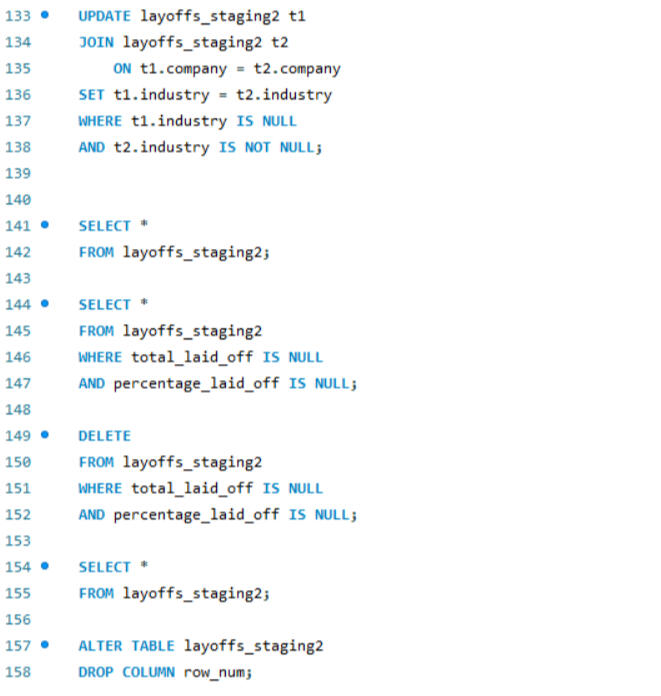
DATA CLEANING
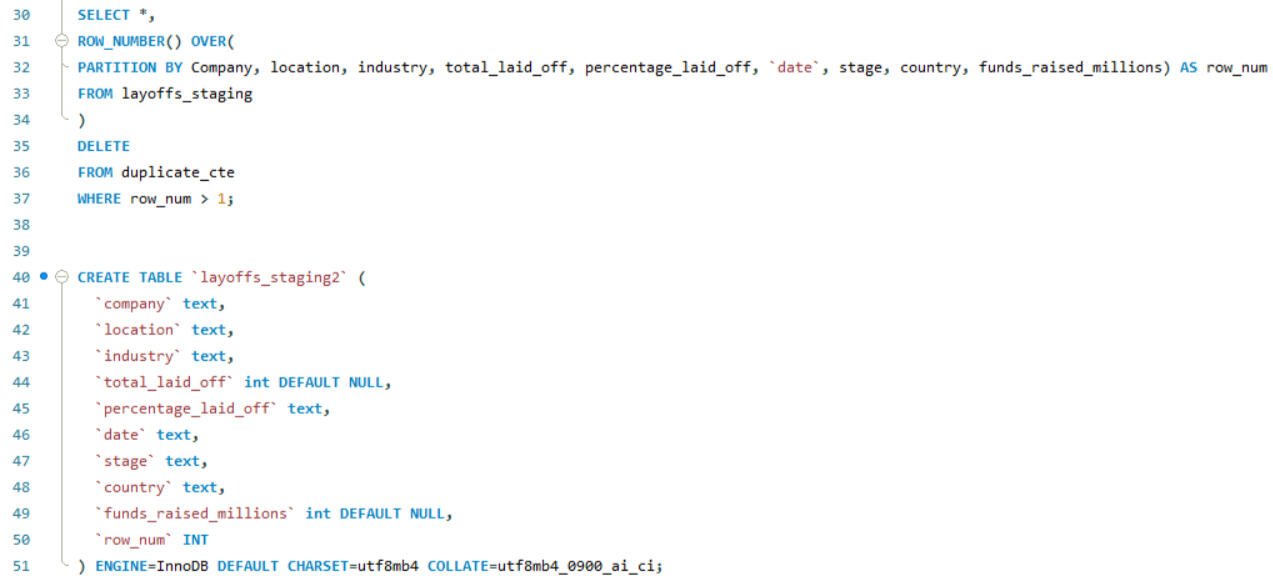
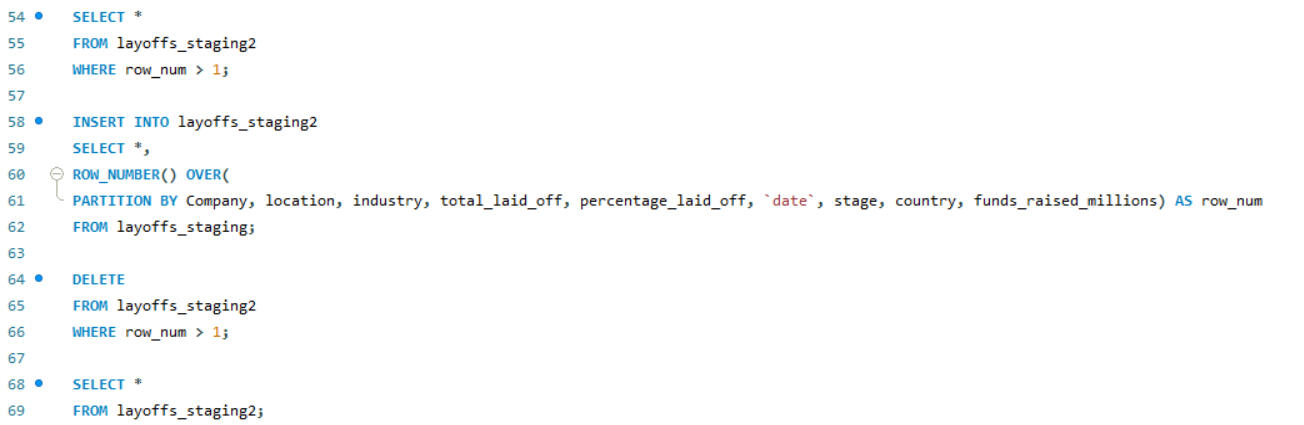
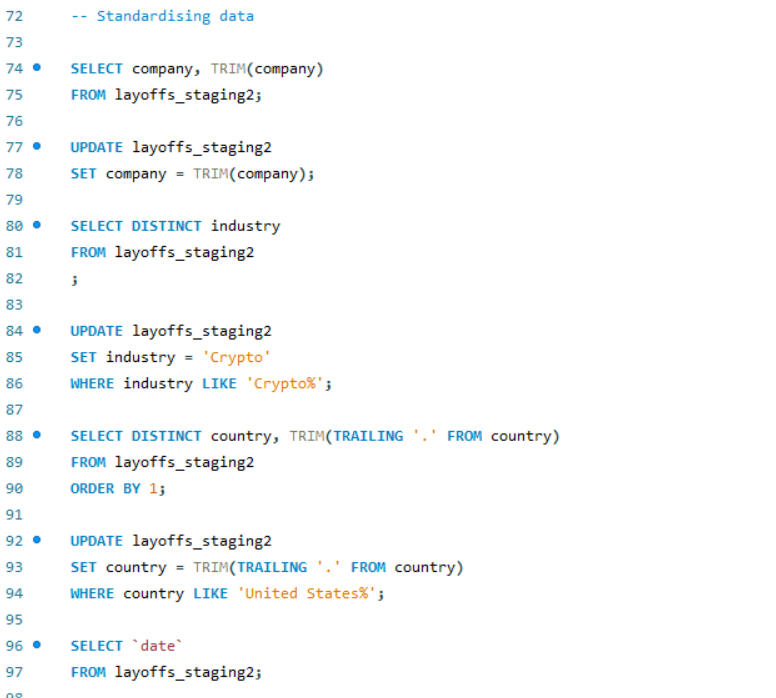

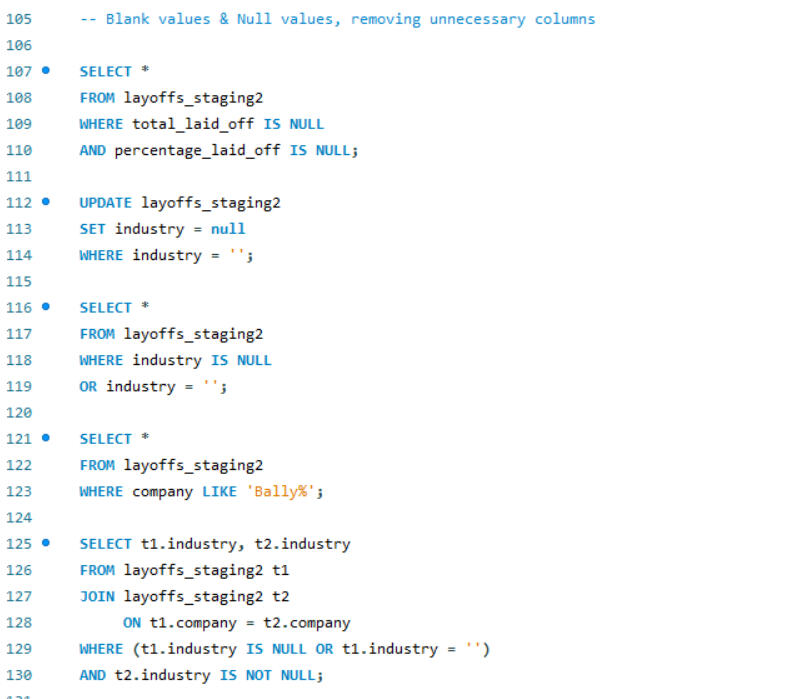
OUTPUT GLIMPSE
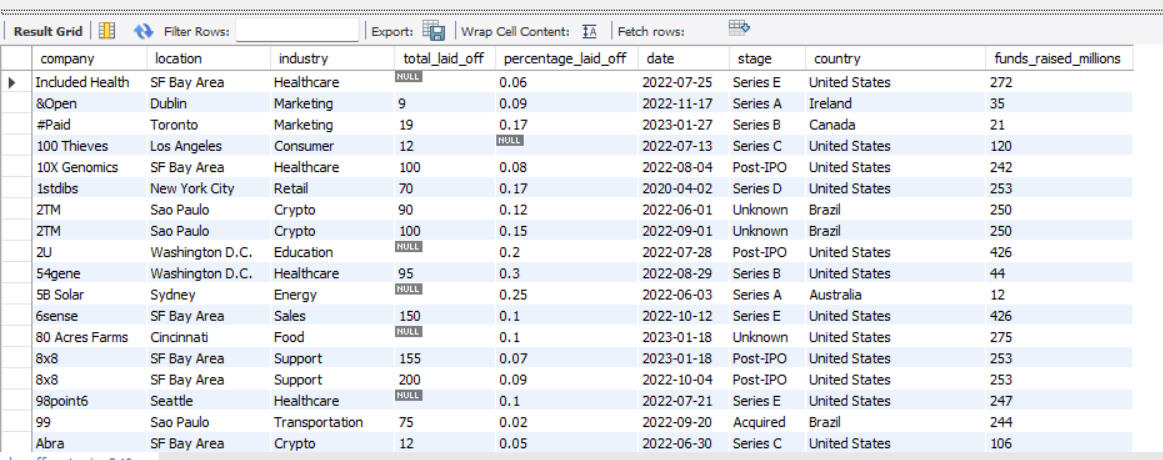
SQL is also a powerful tool for data cleaning. In this project, I worked on cleaning an employee layoff dataset, which involved several key steps: removing duplicates, standardizing data formats, handling blank and null values, and deleting unnecessary rows and columns. These processes ensures that the dataset was accurate, consistent, and ready for further analysis.
SUPPLY CHAIN OPTIMISATION- LINEAR PROGRAMMING
ASSIGNMENT PROBLEM
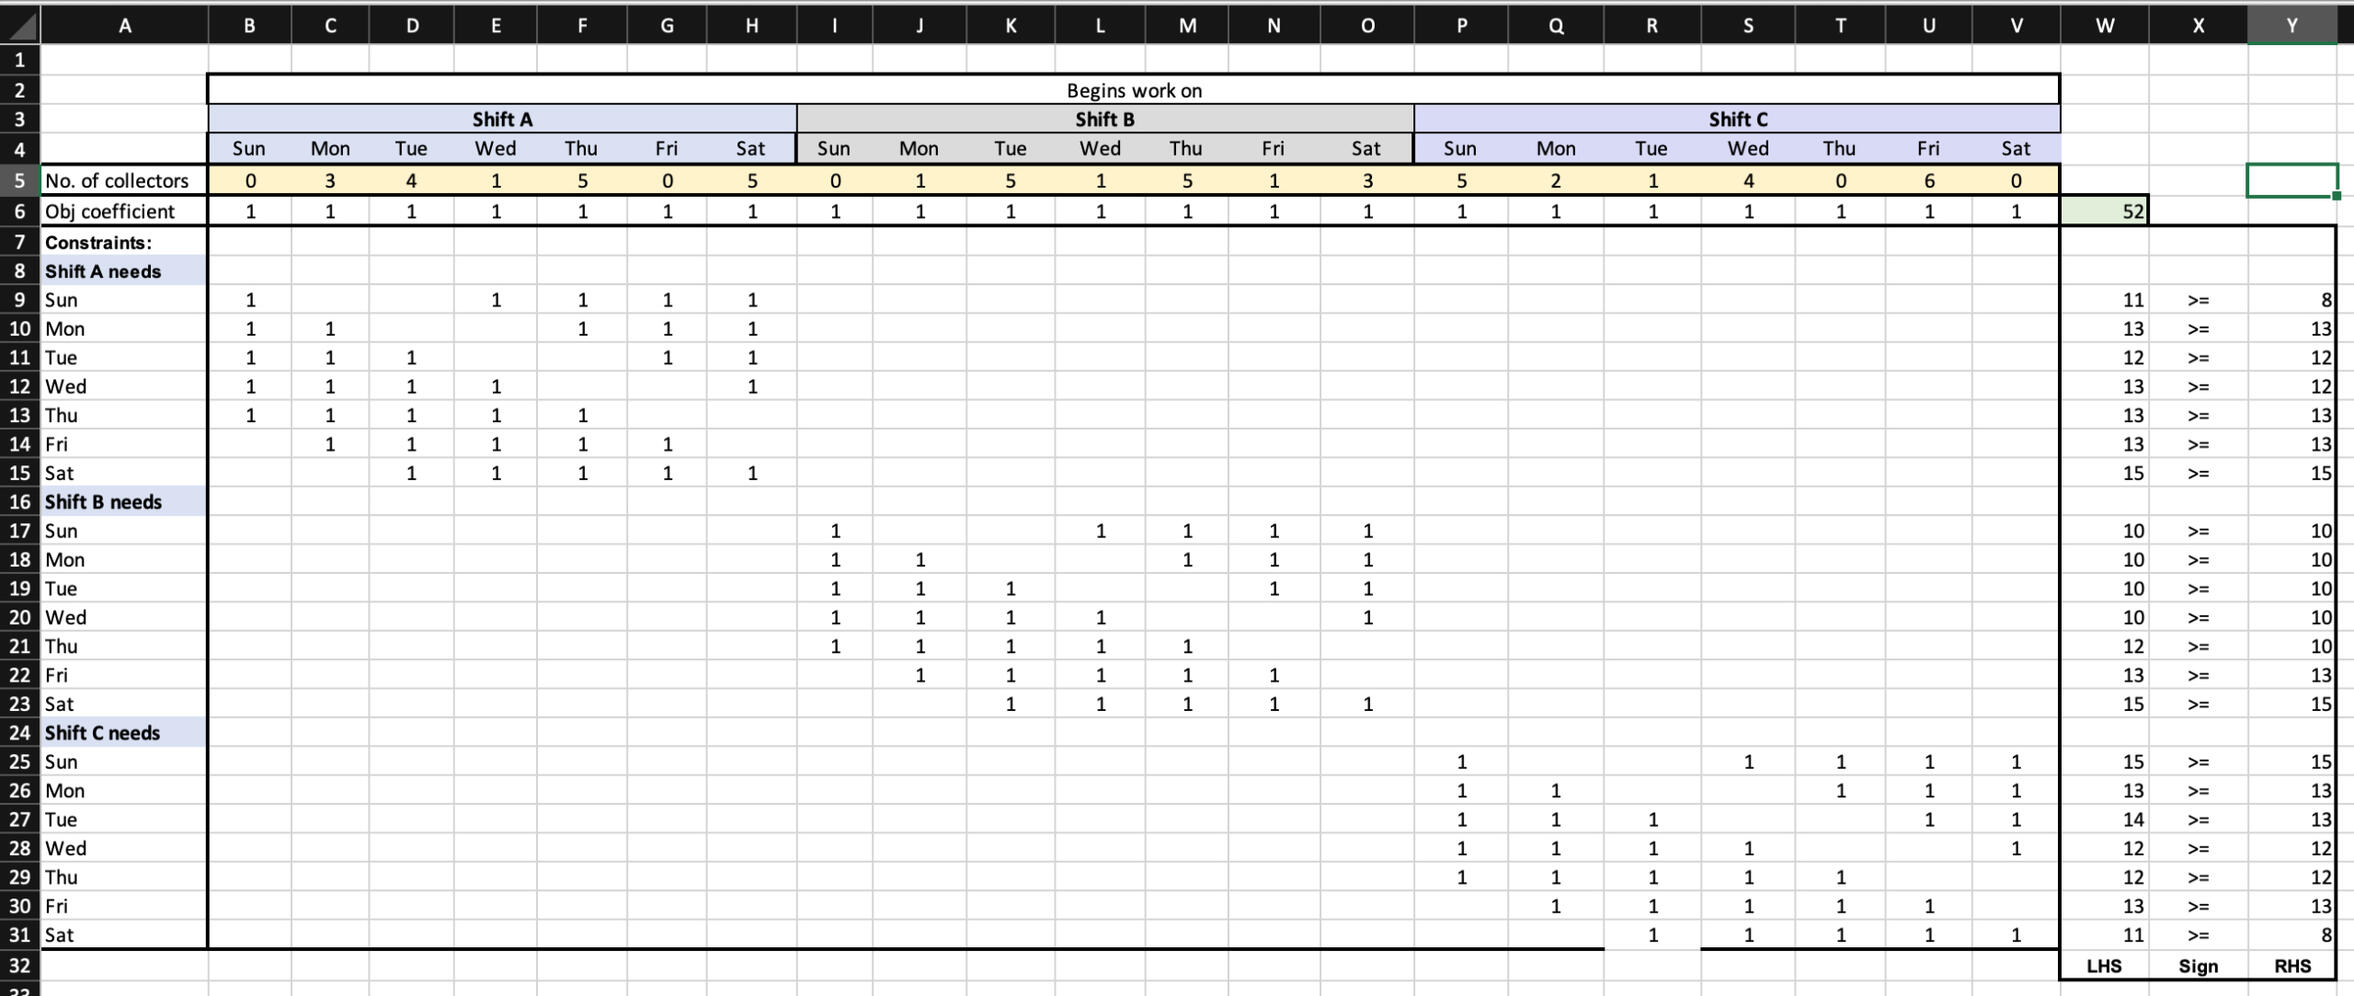
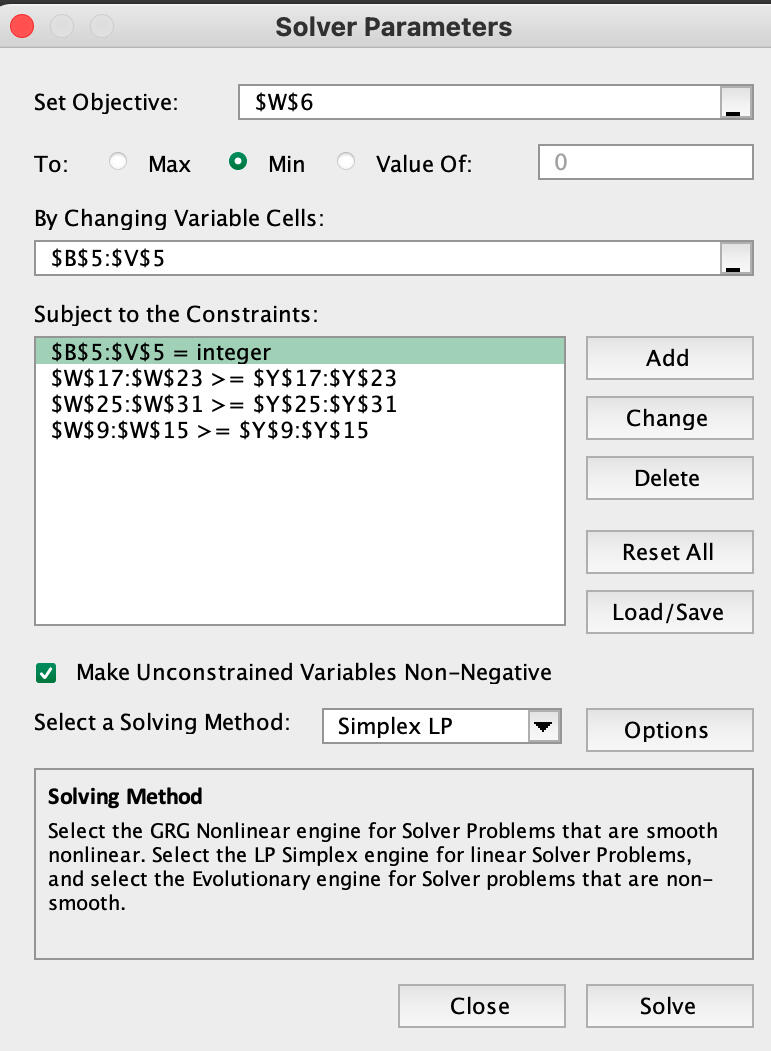
This utilizes linear programming (LP) to optimize resource allocation. I focused on determining the minimum number of toll collectors required to meet traffic demands for a new toll bridge. The problem was modeled using LP techniques to satisfy shift requirements while adhering to union constraints, such as full-time employment and fixed shift schedules. This model ensures that personnel costs are minimized while maintaining operational efficiency, demonstrating the application of mathematical optimization in real-world scenarios.
TRANSHIPMENT PROBLEM
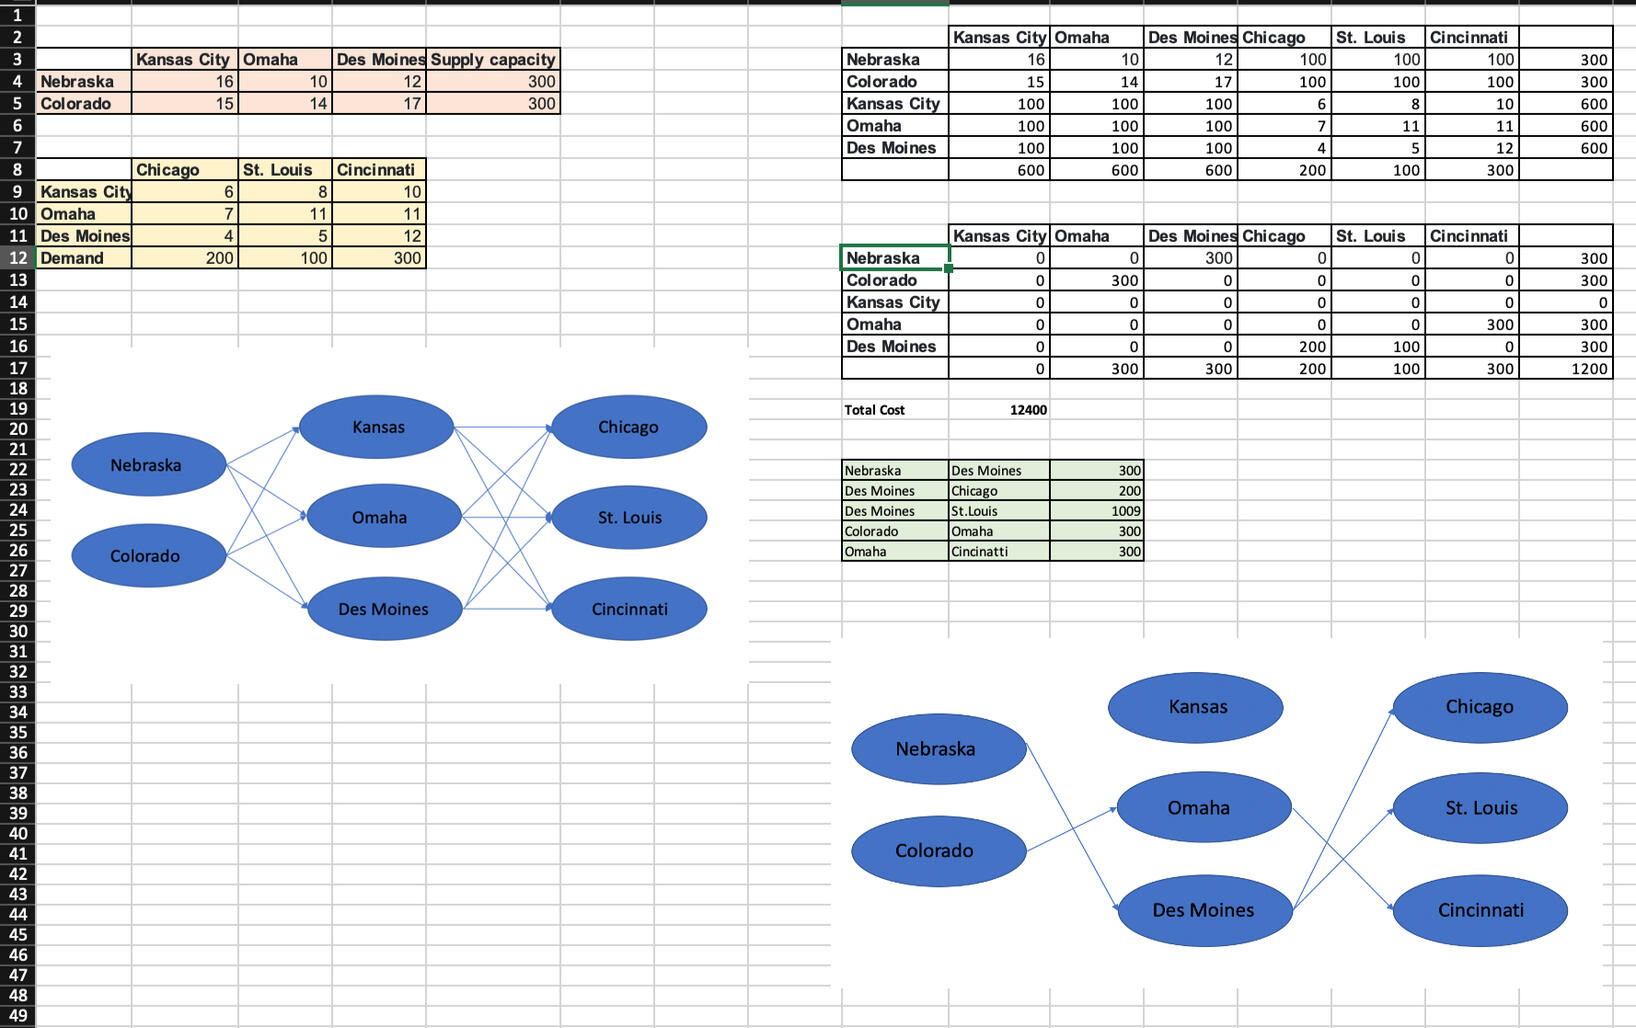
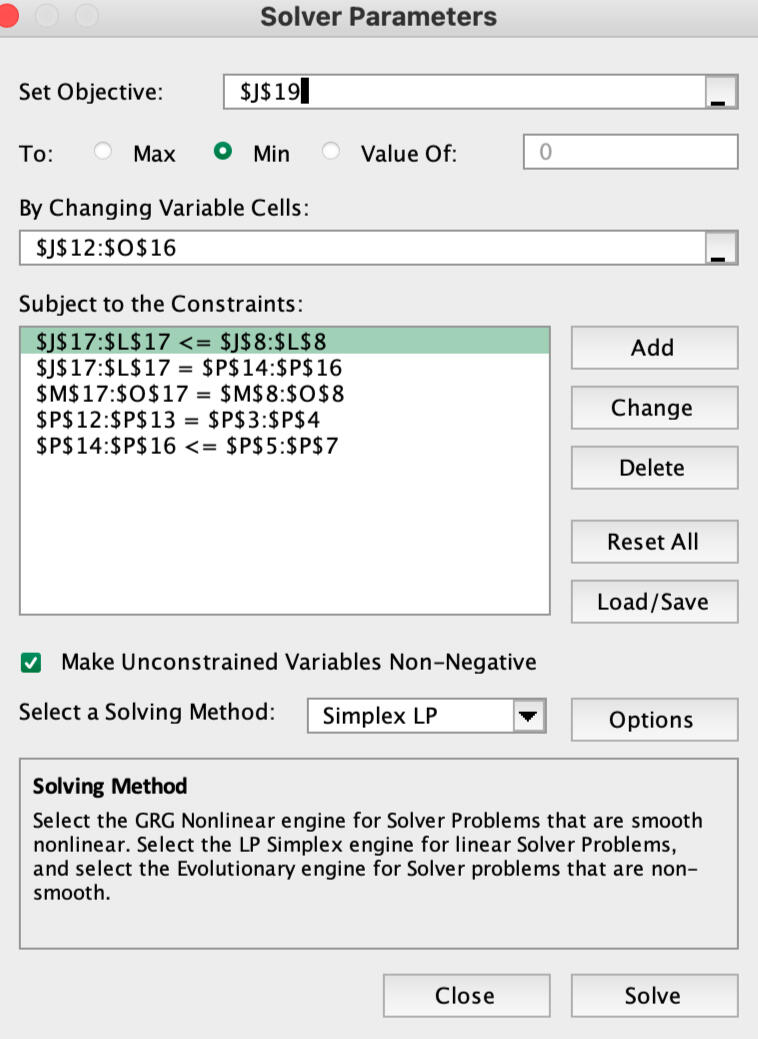
This is a transshipment problem for Manufacturing company, where the objective was to optimize the shipment of products to warehouse locations across the USA. This project involved applying linear programming (LP) techniques to determine the most cost-effective routing of goods through various transshipment points. By optimizing the transportation routes, the goal was to minimize overall shipping costs while ensuring timely delivery to all warehouse destinations. The new mapping on the right side on the above excel sheet suggests the best optimized route.
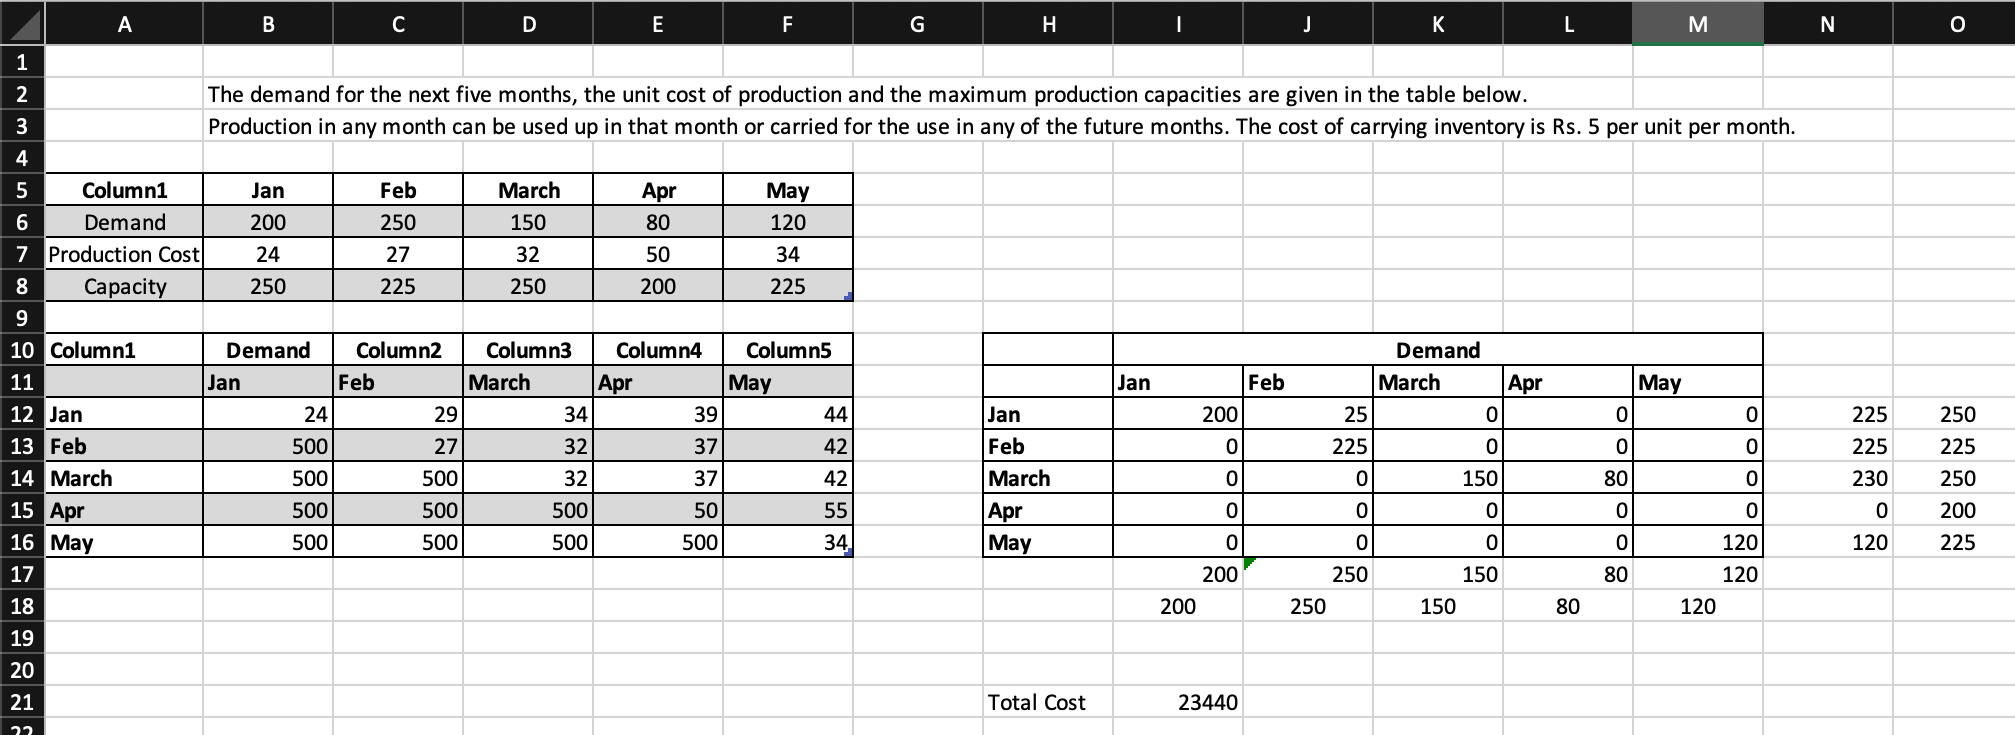
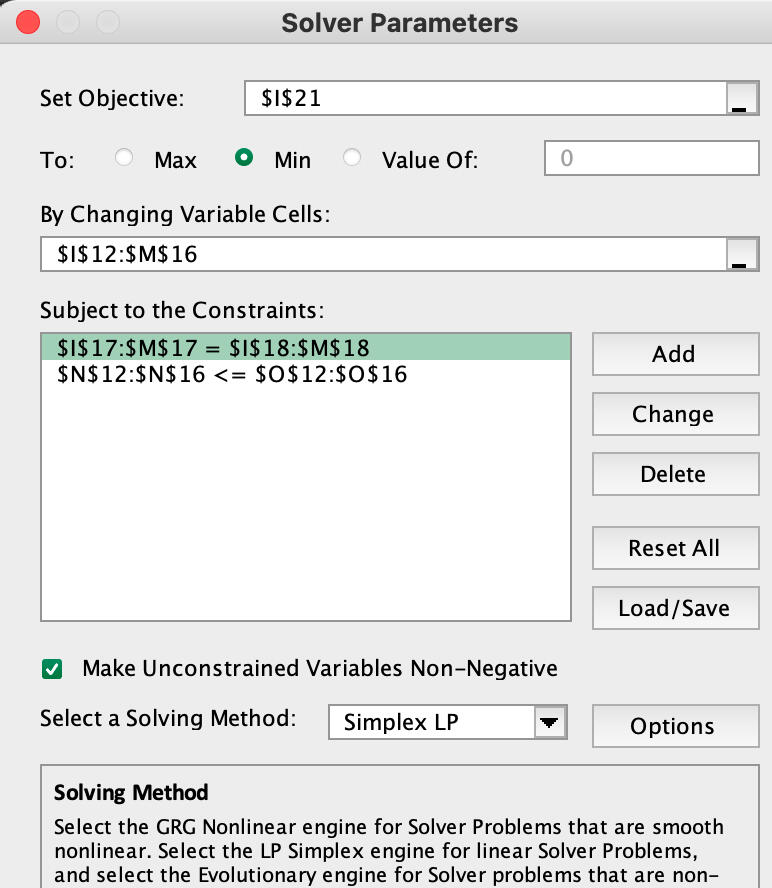
PRODUCTION PLANNING
TESTIMONIALS

GLOBAL MARKETING CASE ANALYSIS
As part of the team work, In analyzing the Ciba-Geigy and Fisher Price case studies that were published by Harvard Business School, I identified the core problem statements and action issues, followed by a comprehensive SWOT analysis to evaluate the feasibility and risks associated with launching the product. I developed a detailed marketing mix, with strategic pricing, distribution, and promotional approaches tailored for the target market. Additionally, conducted in-depth analyses using PESTEL, Porter’s Five Forces, Speed of Diffusion, Red Ocean Strategy, and the 6C’s Channel Strategy, alongside logistics and other marketing frameworks, to ensure robust planning. Based on these insights, actionable recommendations for a go-to-market plan and risk mitigation strategies that aligned with business objectives were proposed. This involved researching market dynamics, building integrated strategic business plans, and delivering presentations to communicate findings effectively.